Fractal generator
Function developed to create the "Dragon curve" fractal with animation and modifiable parameters.
Intro
Fractals were my first connection with math through a playful lens. I found it fascinating that the structure of a fractal, so complex and of biological appearance, could be explained with a simple repetitive process.
When I started this project I wanted to develop code that copies this process, imitating a pencil stroke. All my previous experience with graph generation was with Python, for data processing, so I had never developed code with such an artistic focus. That’s why my first idea was to understand what other coders were doing to achieve this result.
Code development
My starting point was this tutorial by The Coding Train, where they work with vectors. I decided to take another alternative, since I wasn’t looking for an infinite generation, and I had in mind an animation style akin to the 3D pipes windows 98 screensaver. So I decided to implement a 2d canvas with javascript.
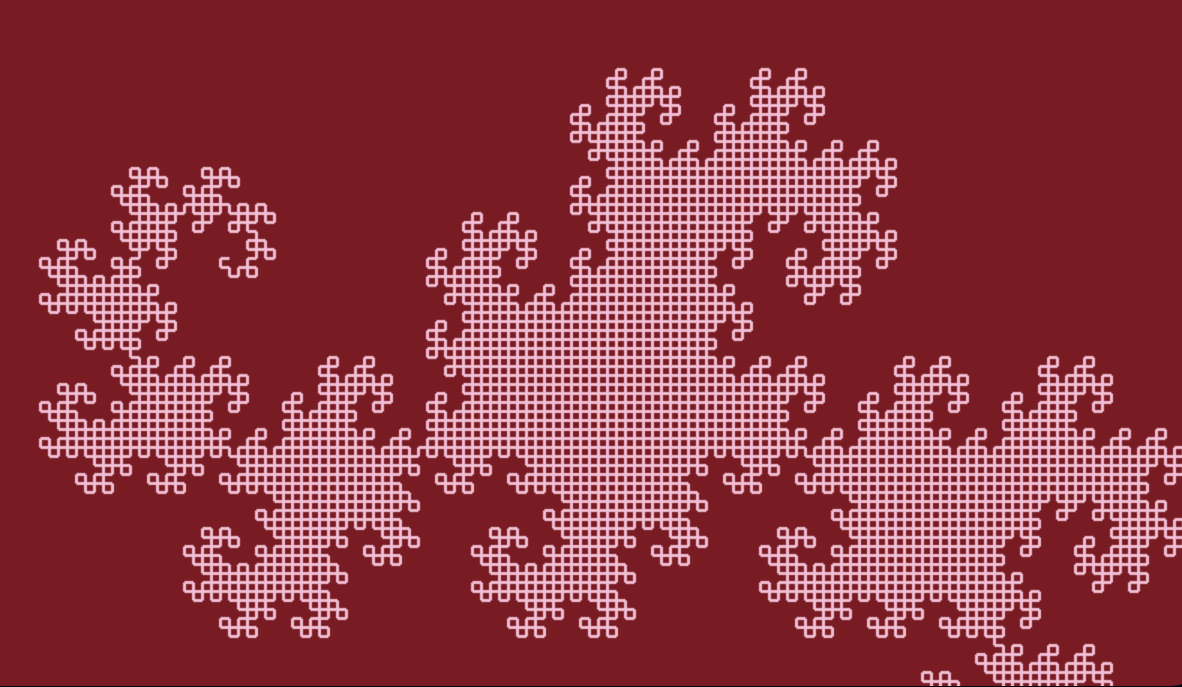
This fractal, “the dragon curve”, happens by copying, rotating, concatenating and repeating. It starts with a line that, when rotated 90° on one of its ends, creates an L shape. This L is then again, copied and rotated on one of its ends. After about 6 iterations one can start to make out the characteristic shape of this fractal.
By Rjlarso - Own work, CC BY-SA 4.0, Link
To make the array of dots with which then connect and make my curve I made a dot class and coded this process of copying, rotating and concatenating. Rotation was made with the simple transformation: (x,y) → (y,-x).
The greatest hurdle for this project was my familiarity with the tools for the canvas element in JS, but having such a clear idea of the process and desiered product made it easier.
You can see the code in action both in this interactive fractal generator, or in my git repository.